

| NIFTY WEEKLY ANALYSIS |
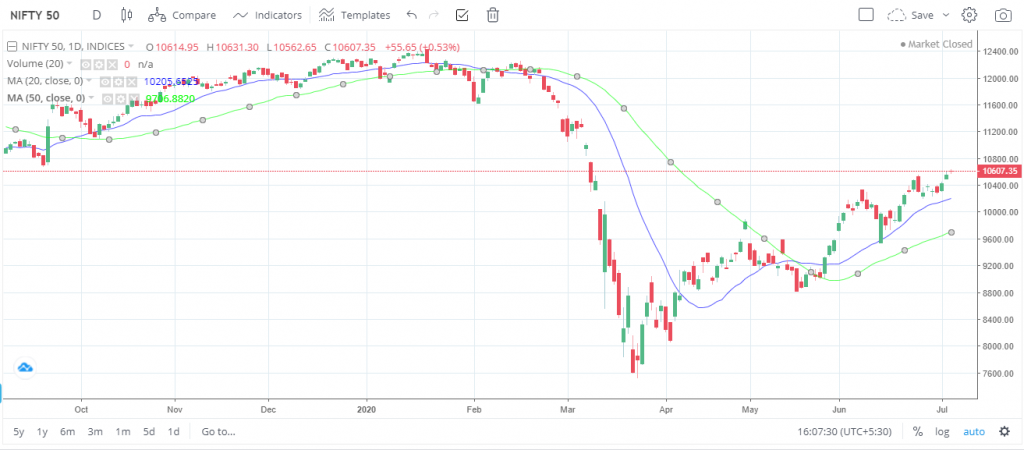
| OPEN: 10615 | HIGH: 10631.3 | |
| LOW: 10562.6 | CLOSE: 10607.4 | |
| FRIDAY GAIN/LOSS: 0.53% | THURSDAY GAIN/LOSS 1.17% | |
| WEDNESDAY GAIN/LOSS 1.24% | NIFTY LOT SIZE: 75 |
NIFTY continuously moving up for the last 3 days. Now if NIFTY sustains above 10700, we will see more positive moves, but if NIFTY breaks below 10500 we will see a down fall. Stocks which have a strong relation with the NIFTY index have provided good returns this week.
NIFTY may retest 10500 Level. We will observe some consolidation around 10500 and 10700
NIFTY is trading above 20 days and 50 days moving average.
| NIFTY CHART |
| STOCK ANALYSIS |
| Company | Open | High | Low | Close | Fri % Gain/Loss | Thurs % Gain/Loss | Wed % Gain/Loss |
| HDFC | 1905.55 | 1908 | 1867.3 | 1885.2 | -0.22 | 2.96 | 4.59 |
| HEROMOTOCO | 2680 | 2750 | 2677.6 | 2738.25 | 2.5 | 4.87 | 0.02 |
| ITC | 208 | 208.5 | 206 | 207.55 | 0.83 | 1.45 | 4.24 |
| RELIANCE | 1779.8 | 1793 | 1768 | 1787.9 | 1.57 | 1.31 | 1.97 |
| TCS | 2163.65 | 2205 | 2160.25 | 2199.65 | 1.97 | 3.11 | 0.48 |
In last 3 days HDFC, Hero Motor, ITC, Reliance and TCS have provided positive returns.
There are buying opportunities left on these stocks.


29 Trackbacks / Pingbacks
Comments are closed.