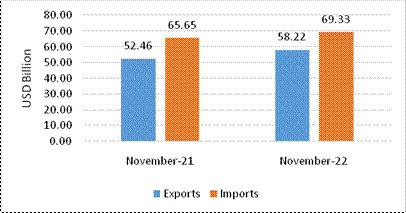
- India’s trade exhibited an impressive performance with India’s overall export (Merchandise and Services combined) of USD 58.22 Billion in November 2022. The exports exhibited a positive growth of 10.97 per cent over the same period last year. Overall import in November 2022* is estimated to be USD 69.33 Billion, exhibiting a positive growth of 5.60 per cent over the same period last year.
- India’s overall exports (Merchandise and Services combined) in April-November 2022 are estimated to exhibit a positive growth of 17.72 per cent over the same period last year. As India’s domestic demand has remained steady amidst the global slump, overall imports in April-November 2022 are estimated to exhibit a growth of 29.47 per cent over the same period last year.
Table 1: Trade during November 2022*
| November 2022(USD Billion) | November 2021(USD Billion) | ||
| Merchandise | Exports | 31.99 | 31.80 |
| Imports | 55.88 | 53.03 | |
| Services* | Exports | 26.23 | 20.67 |
| Imports | 13.44 | 12.63 | |
| Overall Trade(Merchandise+Services) * | Exports | 58.22 | 52.46 |
| Imports | 69.33 | 65.65 | |
| Trade Balance | -11.11 | -13.19 |
* Note: The latest data for the services sector released by RBI is for October 2022. The data for November 2022 is an estimation, which will be revised based on RBI’s subsequent release. (ii) Data for April-November 2021 and April-June 2022 has been revised on a pro-rata basis using the quarterly balance of payments data.
Fig 1: Overall Trade during November 2022*
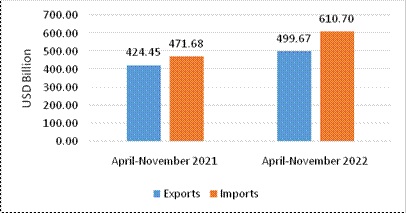
- India’s overall exports (Merchandise and Services combined) in April-November2022* are estimated to be USD 499.67 Billion. Overall imports in April-November 2022* are estimated to be USD 610.70 Billion.
Table 2: Trade from April-November 2022*
| April-November 2022(USD Billion) | April-November 2021(USD Billion) | ||
| Merchandise | Exports | 295.26 | 265.77 |
| Imports | 493.61 | 381.17 | |
| Services* | Exports | 204.41 | 158.67 |
| Imports | 117.09 | 90.52 | |
| Overall Trade(Merchandise+Services) * | Exports | 499.67 | 424.45 |
| Imports | 610.70 | 471.68 | |
| Trade Balance | -111.02 | -47.23 |
Fig 2: Overall Trade during April-November 2022*
MERCHANDISE TRADE
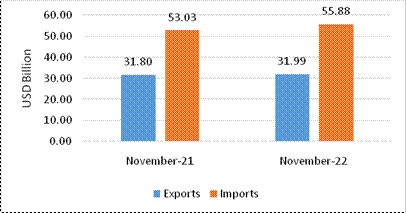
- Merchandise exports in November 2022 were USD 31.99 Billion, as compared to USD 31.80 Billion in November 2021.
- Merchandise imports in November 2022 were USD 55.88 billion, as compared to USD 53.03 Billion in November 2021.
Fig 3: Merchandise Trade during November 2022
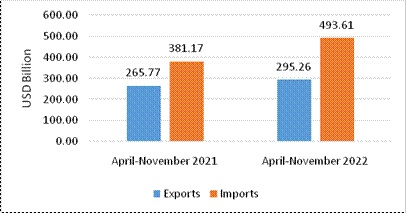
- Merchandise exports for the period April-November 2022 were USD 295.26 Billion as against USD 265.77 Billion during the period April-November 2021.
- Merchandise imports for the period April-November 2022 were USD 493.61 Billion as against USD 381.17 Billion during the period April-November 2021.
- The merchandise trade deficit for April-November 2022 was estimated at USD 198.35 Billion as against USD 115.39 Billion in April-November 2021.
Fig 4: Merchandise Trade during April-November 2022
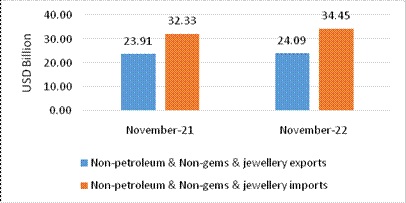
- Non-petroleum and non-gems & jewellery exports in November 2022 were USD 24.09 Billion, compared to USD 23.91 Billion in November 2021.
- Non-petroleum, non-gems & jewellery (gold, silver & precious metals) imports were USD 34.45, compared to USD 32.33 Billion in November 2021.
Table 3: Trade excluding Petroleum and Gems &Jewellery during November 2022
| November 2022(USD Billion) | November 2021(USD Billion) | |
| Non-petroleum exports | 26.59 | 26.30 |
| Non-petroleum imports | 40.14 | 38.78 |
| Non-petroleum & Non-Gems &Jewellery exports | 24.09 | 23.91 |
| Non-petroleum & Non-Gems &Jewellery imports | 34.45 | 32.33 |
Note: Gems &Jewellery Imports include Gold, Silver & Pearls, precious & Semi-precious stones
Fig 5: Trade excluding Petroleum and Gems &Jewellery during November 2022
- Non-petroleum and non-gems & jewellery exports from April-November 2022 were USD 206.16 Billion, as compared to USD 200.43 Billion in April-November 2021.
- Non-petroleum, non-gems & jewellery (gold, silver & precious metals) imports were USD 293.83 Billion in April-November 2022 as compared to USD 230.91 Billion in April-November 2021.
Table 4: Trade excluding Petroleum and Gems &Jewellery during April-November 2022
| April-November 2022(USD Billion) | April-November 2021(USD Billion) | |
| Non-petroleum exports | 232.61 | 226.34 |
| Non-petroleum imports | 347.04 | 285.11 |
| Non-petroleum & Non-Gems &Jewellery exports | 206.16 | 200.43 |
| Non-petroleum & Non-Gems &Jewellery imports | 293.83 | 230.91 |
Note: Gems &Jewellery Imports include Gold, Silver & Pearls, precious & Semi-precious stones
Fig 6: Trade excluding Petroleum and Gems &Jewellery during April-November 2022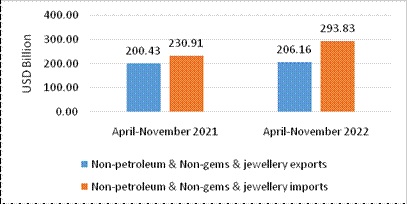
SERVICES TRADE
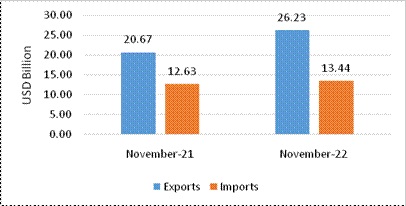
- The estimated value of services exported for November 2022* is USD 26.23 billion, as compared to USD 20.67 Billion in November 2021.
- The estimated value of services imported for November 2022* is USD 13.44 Billion as compared to USD 12.63 Billion in November 2021.
Fig 7: Services Trade during November 2022*
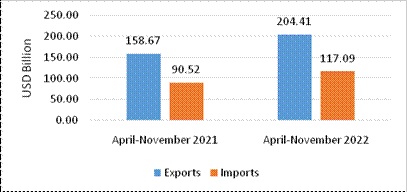
- The estimated value of services exported for April-November 2022* is USD 204.41 Billion as compared to USD 158.67 Billion in April-November 2021.
- The estimated value of services imports for April-November 2022* is USD 117.09 as compared to USD90.52 Billion in April-November 2021.
- The services trade surplus for April-November 2022* is estimated at USD 87.32 Billion as against USD 68.16 Billion in April-November 2021.
Fig 8: Services Trade during April-November 2022*
- India’s trade exhibited a phenomenal performance in 2021-22 attaining unprecedented exports in Merchandise and Services such that exports reached an all-time high. The global economy poses tremendous challenges in the current year as it continues to navigate an increasingly turbulent and uncertain environment. However, India’s trade is moving forward on the high growth wave even with the high base of last year and despite global demand slowdown, exports performance continues on the high growth run with India’s overall exports (Merchandise and Services combined) in April-November 2022 estimated to exhibit a positive growth of 17.72 per cent over the same period last year. However, since India’s domestic demand has remained steady amidst the global slump, overall imports in April-November 2022 are estimated to exhibit a growth of 29.47 per cent over the same period last year.
- India’s merchandise exports exhibited a positive (y-o-y) growth in 15 out of 30 sectors in November as compared to the same period last year and imports have increased in 19 out of 30 sectors (y-o-y). Among the QE commodity groups, electronic goods (54.48%), gems and jewellery (4.61%), RMG of textiles (11.70%), drugs and pharmaceuticals (8.66%), rice (19.16%), leather & leather products (8.68%), ceramic products & glassware (22.64%), fruits and vegetables (25.01%), cereal preparations & miscellaneous processed (22.75%), other cereals (53.78%), oil seeds (38.83%), oil meals (17.55%), tobacco (101.02%), tea (27.03%) and coffee (3.21%) registered positive growth (y-o-y) in November 2022.
- As a thriving economy with close integration into the global value chain, certain sectors do face the challenges of slowing global demand more severely than others. The engineering and iron ore products are one example where demand slowdown from major trade partners due to declining economic activities. Moreover, the 15% export duty on steel weighed on engineering exports but its removal now should improve the situation. There is a decline in exports in the chemical sector in dyes and organic chemicals due to a slowdown in demand in traditional textile markets such as China, Turkey, and Bangladesh. Indian textile exports fell due to a global demand slowdown as high inflation across the developed world has reduced consumers’ purchasing capacity. Export of high-volume items like Paraxylene, Ethylene Glycol etc., are impacted due to low price realisation from traditional export markets and higher domestic industry demand. India’s plastics exports also face challenging conditions this year due to signs of recession in major markets including the USA and Europe. India’s plastic raw material exports have fallen as polymer producers prefer to sell in the domestic market since price realisations within India are currently better than in the export market. With regard to poultry export, there is a reduction due to the bird flu which has resulted in reduced demand from major importing countries.
- As resilient domestic demand, a re-invigorated investment cycle along with a strengthened financial system and structural reforms have kept the economy on an upswing. Certain domestic demand-supply gaps and natural requirements for a large economy like ours necessitate imports. For example, crops across India are dependent on Fertilizers import and the geopolitical conflict has also roiled up the market for crucial chemicals. Moreover, pressure from persistently high global inflation despite accelerated monetary tightening has also raised the import bill for essential commodities like crude petroleum, coking coal, etc. that need to be imported.